Ease Into Prep with an SAT® Question of the Day
Answer the question below and see how ready you are. We’ll explain the correct answer in detail so you understand the concept.
A little daily practice goes a long way.
Answer the question below and see how ready you are. We’ll explain the correct answer in detail so you understand the concept.
A little daily practice goes a long way.
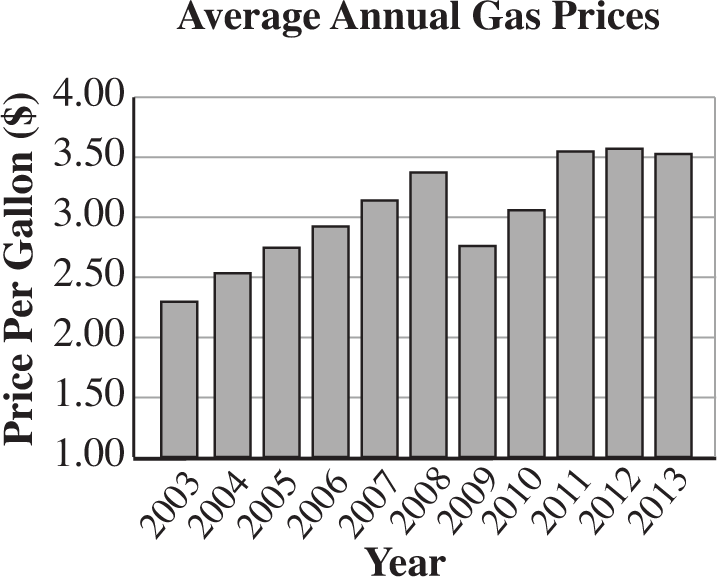
The figure above shows the average annual gas prices in the United States from 2003 to 2013. Based on the information shown, which of the following conclusions is valid?
No matter where you are on your journey, Kaplan's expert teachers can help you raise your score.
Find the course that fits you best.
| Reading & Writing | Math |
|
|